
Course Description
Power BI continues to rock the world of analytics. It offers numerous opportunities to all businesses and sectors to drive digital transformation for increased growth and profitability. The opportunity to quickly transform data from various sources into actionable insights lies in this powerful tool!
Whether you are a complete beginner or have used Power BI, this course will teach you how to create stunning and interactive dashboards in the form of storytelling.
You will be working with data from open-source websites, analysing trends that lie with that data, and creating visuals to communicate the results that are intuitive and interactive.
The two days workshop focuses on applied learning that helps you in mastering the art of using Power BI to design reports and charts that communicate data well to your key stakeholders.
Course Objectives
At the end of the course, you will be able to:
- Use the appropriate visualisation tools and techniques to interpret data and findings.
- Select suitable visualisation types to exhibit data for different contexts.
- Construct dashboards and scorecards for data display, including incorporating interactive graphics, visuals, and technical features into the data presentation.
- Communicate data in the form of storytelling.
Course Outline
Introduction to Data Visualisation and Power BI Basics
- You will learn the four steps in data interpretation and findings, including selecting the appropriate visualisation tools and techniques to display information and convey data and findings.
Creating Custom Visuals
- You will learn the types of visualisation in Power BI and apply interactive graphics, visuals, and technical features to the data presented.
Prepare and Transform Data in Power Query Editor
- You will learn to incorporate appropriate elements to create informative and dynamic data displays suitable for different contexts.
Storytelling with Data
- You will learn to communicate data in the form of storytelling.
The Data Model: Knowing the relationships and DAX
- You will learn to construct dashboards and scorecards for data display, including interpreting the different elements in the Power BI dashboard.
Pre-requisites:
• Age: Minimum 18 years old
• Minimum of GCE O levels academic qualification or Workplace Literacy and Numeracy (WPLN) score: Level 5 for Reading,
Speaking, Listening, Writing and Numeracy
• At least 1 year of working experience
• Basic knowledge in business, marketing and be familiar with computer software like Microsoft Excel.
Course Duration: 2 days, 9am – 6pm
(14.5 hours of training, 1.5 hour of assessment)
Course Schedule
- 19 & 20 Feb 2024 (Mon & Tue) – JTC Summit
- 29 & 30 Apr 2024 (Mon & Tue) – JTC Summit
Course Fees & Schedule
Full Course Fee: $880 + $79.20 (9% gst) = $959.20 (Inclusive of gst)
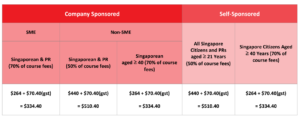
Company Sponsored
• Absentee Payroll applicable for both SMEs & Non-SMEs
– For course commencement Jan 2022, absentee payroll funding is $4.50 per hour capped at $100,000 per enterprise per calendar year
Self-Sponsored
• Skillsfuture Credit is eligible for Singapore Citizens aged 25 and above.
• Singaporean aged 17 to 30 may use PSEA (Post-Secondary Education Account) for fee payment.
• You may use U-tap to defray 50% of the unfunded course fee
Course register online by clicking this link: Online Registration
For further enquiries, please contact : 8879 9216 or 91143867
Reach out to us via our other channels: More Contact Channels
Course Code: TGS-2022015157
ASK Training